Stata: Drawing regression lines across groups

Friday, December 18, 2009

When performing regression, one commonly compare groups, and the simple way to observe the differences is through graphs. Stata offers several ways to draw graphs. Here are two options.
 

1.png
Option 1:

regress inc educ male, beta
predict incfnoi if male==0
predict incmnoi if male==1
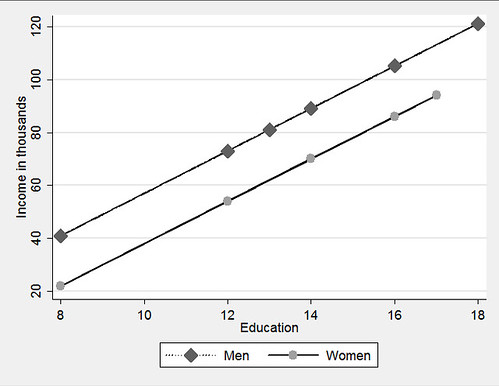
twoway (connected incmnoi educ if male==1, lcolor(black) ///
lpattern(dot) msymbol(diamond) msize(large)) ///
(connected incfno educ if male ==0, lcolor(black) ///
lpattern(solid) msymbol(circle) msize(large)), ///
ytitle(Income in thousands) xtitle(Education) ///
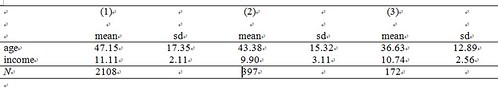
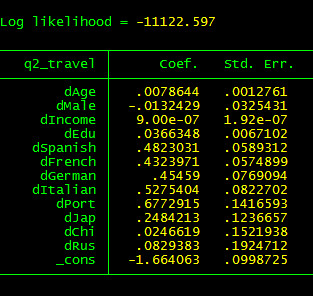
legend(order(1 "Men" 2 "Women")) scheme(s2manual)


This code snippet is from A gentle introduction to Stata. The results are presented above.
Option 2:

Install the two packages first:

net describe postgr3, from(http://www.ats.ucla.edu/stat/stata/ado/analysis)
net install postgr3.pkg
net describe xi3, from(http://www.ats.ucla.edu/stat/stata/ado/analysis)
net install xi3.pkg


followed by the code:

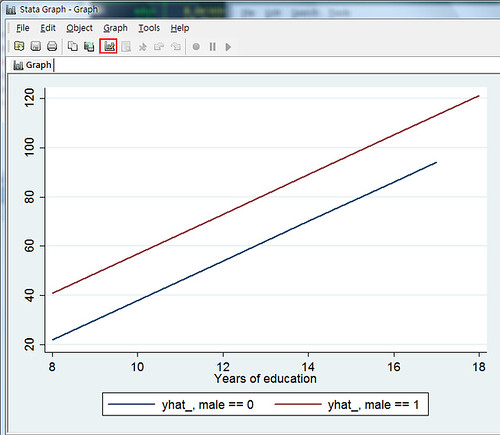
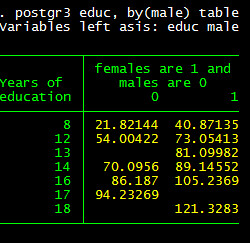
xi3: regress inc educ male, beta
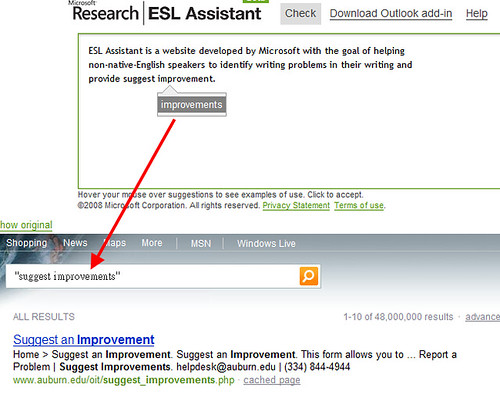
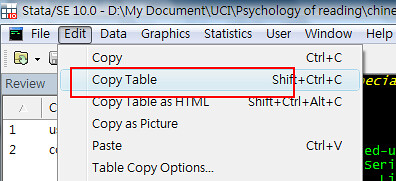
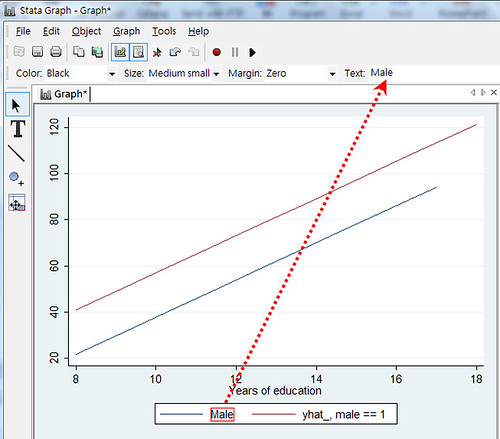
postgr3 educ, by(male) table


Just two lines, isn’t that cool? Umm? Do you notice anything wrong? If you don’t like  footnotes, such as yhat_, male==0, you can click the highlighted part below and make some changes.

2.png

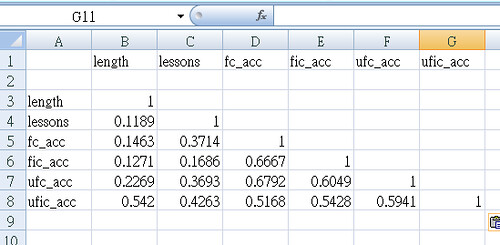
Select the area you wish to change, and change it in the area indicated by the red arrow.

3.png

This also provides a table with which to ensure everything is correct.

4.png

You can get more information on the UCLA website here: http://www.ats.ucla.edu/stat/stata/ado/analysis/postgr3.htm

You can also use predxcat and predxcon, with the command findit to get these two packages. I think that options 1 and 2 are adequate. Option 2 also allows you to draw interaction easily. I’ll talk about this in my next post.

Deals on Stata book

Saturday, October 31, 2009


a gentle introduction 3rd.png
A gentle introduction to Stata 


This is a perfect book for beginners.


There are 13 chapters:
1 Getting started
2 Entering data
3 Preparing data for analysis
4 Working with commands, do-files, and results
5 Descriptive statistics and graphs for one variable
6 Statistics and graphs for two categorical variables
7 Tests for one or two means
8 Bivariate regression and correlation
9 Analysis of variance
10 Multiple regression
11 Logistic regression
12 Measurement, reliability, and validity
13 Appendix: What's next?

I like this book because it covers concepts related to statistics as well as their application in a single book. It also tells you how to interpret the results obtained from the Stata output. For example, on page 178, after running a multiple regression:

regress csat expense percent income high college

the results with multiple regression equation are shown :

predicted csat = 851.56 + .00335 expense – 2.618 percent + .0001 income + 1.63 high + 2.03 college

This book also provides helpful interpretations:
Controlling for four other variables weakens the coefficient on expense from –.0223 to .00335, which is no longer statistically distinguishable from zero. The unexpected negative relationship between expense and csat found in our earlier simple regression evidently is spurious, and explained by other predictors.
Only the coefficient on percent (percentage of high school graduates taking the SAT) attains significance at the .05 level. We could interpret this “fourth-orer partial regression coefficient” (so called because its calculation adjusts for four other predictors) as follows.
This book includes many graphs, and when I learn stats I like to see what the results look like. This helps me to understand and remember the concepts I have studied. Visit A gentle introduction to Stata and find out today's deal on Amazon.

Stata: How to export descriptive statistics tables?

Friday, September 25, 2009

When performing statistics analysis, the first thing you would probably do is to run descriptive statistics. Knowing how to export tables of descriptive statistics can save a considerable amount of time.

If you would like to obtain the exact results that I did, you could use the following code for your  dataset:

use http://twtcsl.org/dataset/gss2000.dta
tab race
tab race sex
sum race sex age income
tab race, gen(d)
rename d1 dwhite
rename d2 dblack
rename d3 dother
tab sex, gen(d)
rename d1 dmale
rename d2 dfemale
sum dwhite dblack dother dmale age income if !mi(age) & !mi(income)


The results:

5.png

How do we export it? You can use EDIT-COPY TABLE in stata dropdown menu, or write some code to do the work.

estpost sum dwhite dblack dother dmale age income if !mi(age) & !mi(income)
esttab using sum2.rtf, cells("mean(fmt(2)) sd(fmt(2)) min(fmt(1)) max(fmt(0))") nomtitle nonumber replace


The export table looks like this:
1.png

To obtain three digits after the decimal point, change fmt(2) to fmt(3).

If you require more advanced descriptive statistics tables, for example, if you wanted to determine age and income by race, you could use the following codes:

sort race
by race: eststo: estpost sum age income if !mi(age) & !mi(income)
esttab using grp_sum.rtf, cells("mean(fmt(2)) sd(fmt(2))") replace


This result in a neat table:
2.png
If you are unable to export tables, check this article
Stata: Export OLS regression table to Word or Excel
and install the estout package.
 

Stata: Dealing with missing values

Friday, September 4, 2009

Dealing with missing values is probably the first thing you do after labeling your variables. Unfortunately, this is not an easy job and many users use inappropriate means to accomplish it. Let’s start at the very beginning.

In Stata 7 and previous versions use only one default missing value “.” (without quote). If you wish to exclude missing values, it would be correct to use the:

if variable !=.

Sample code for OLS regression would resemble the following part:

regress a b if c!=. & d!=.
regress a b c if d!=.
regress a b c d


This would be 100% correct if you used an old Stata dataset; however, if your dataset in had different missing values, this code would be problematic. Stata 8 and later versions allows you do define different types of missing values, each of which begins with a “.” (without quote), such as .a, and .b. Therefore, if you have these missing values in your dataset and you use old code like that above, you would probably obtain inconsistent observation numbers.

The correct way to perform this would be to use if c <. or if  !mi(c). The revised code would similar to:

regress a b if !mi(c) & !mi(d)
regress a b c if !mi(d)
regress a b c d


What if you have 20 variables in your regression? Such if statements often result in very long lines, thereby reducing the readability of your code. There are two easy ways to overcome this: 1) creating a dummy called “touse” with 1 representing valid values for all variables; and 0 for at least one missing value.

gen touse =!mi(y, a, b, c, d)
regress y a b if touse
regress y a b c if touse
regress y a b c d if touse


2) If you don’t like this approach, you can also deal with missing values by using nestreg:

nestreg: reg y (a b) (c) (d)

Endnote: Inputing the name of orgnizations

Tuesday, August 4, 2009

Today, while I was typing a reference by Society for Technology in Education, the following picture appeared:

1.png

That means that it was messed up! Endnote had treated it as the name of a person, but that is not what I wanted. 

When you type a reference written by an organization, you have to perform one additional step. You have to type ",," (without quote) at the end of the name:

2.png

And it works!
3.png

Simple tips are really important!!

Solution: Skype uses more than 50% CPU

Tuesday, June 30, 2009

I cannot remember when it started, but everytime I used Skype, it took more than 5 minutes to log in and automatically logged me out soon. Even worse, I was not able to hear people properly while talking on Skype. This also occurred using other VOIP software, such as MSN.

Eventually, I found this post on the Skype forum: http://forum.skype.com/index.php?showtopic=367371&st=20

I am not the only person having this problem and it turns out that it is caused by ESET NOD32.  Check your ESET NOD32, and whether your personal firewall module is 1049 and your ESET NOD32 version is older than 3.0.684. For more detail, check here: http://kb.eset.com/esetkb/index?page=content&id=SOLN2277&cat=WINNT&actp=LIST

About ESET Smart Security window

Go to here http://www.eset.com/download/index.php and download the latest version, and you may also upgrade to version 4. According to an ESET announcement, “ESET Smart Security 4 and ESET NOD32 Antivirus 4 have arrived! Existing customers with a valid license for either product may upgrade to the latest version of the same product for free! Simply download the latest software and install it on your computer.”

ESL Assistant: Reduce your English writing errors

Saturday, June 27, 2009

ESL Assistant is a website developed by Microsoft with the goal of helping non-native-English speakers by identifying writing problems and suggesting improvements.

1.png

ESL Assistant: http://www.eslassistant.com/

Paste your writing into the text area and click check.
2.png

Errors are highlighted with green or red underlines. Move your mouse over these areas to display a pop-up suggestion box. Move your mouse over the suggestion box to display related keywords appearing in Bing, the new search engine developed by Microsoft. You may check these “sample sentences” and decide whether to follow the suggestions.

Keep in mind that this tool only provides suggestions, and does not necessarily identify all of your errors. In addition, this tool occasionally identifies errors, which are in fact grammatically correct.

EndNote X3 for Windows realeased!

Monday, June 22, 2009

The new version of Endnote for windows was realeased on June 17, 2009. There are many new features:
  • Format bibliographies in OpenOffice.org Writer 3
  • Group references and locate full text in new ways
  • Find More Full Text with EZProxy
  • Work on the desktop and Web


Students in North America can purchase EndNote X3 for $115.95 USD with a valid student I.D.

Stata: Export Logistic Regression (Coefficient/Odds ratio) to Word or Excel

Thursday, June 4, 2009

Stata provides two commands for logistic regression: logit and logistic. Logit reports coefficients; whereas logistic reports odds ratios. The general command for logistic regression appears like this:

logit y x
logistic y x


Logit output:
1.png

Logistic output:
2.png

If you want to export the coefficients to Word or Excel, it is the same as exporting an OLS regression. Here is the code I used:

esttab * using logistic1.csv, b(3) pr2

Exporting odds ratios requires transformation. The key is “eform” at the end of this command:

esttab * using logistic2.rtf, b(3) pr2 eform

and the results in Word look like this:
3.png

If you require t-test, you may use the following code:

esttab * using logistic3.csv, cells("b(fmt(3) star)" t(par fmt(2))) pr2 
 

Stata: Outputting correlation tables

Monday, June 1, 2009

There are two ways to export correlation tables from Stata to Word or Excel. The first approach works only on Windows. You first select your correlation table and copy it.

1.png

2.png


You then paste it into Excel and do some editing.
3.png

If you would like stars after your correlation coefficient, run a command like this:

pwcorr X1 X2 X3 X4, star(.05)

and then copy the table as mentioned above. It will look like this when you paste it into Excel

4.png

The second way is to use esttab, in which the command looks like this:

estpost correlate x1 x2 x3 x4, matrix listwise
est store c1
esttab * using test_correlation.rtf, unstack not noobs compress

Stata: Export OLS regression table to Word or Excel

Wednesday, May 27, 2009

Stata is a statistics software package with many neat modules that can help you to reduce your workload. One of my favorite modules is estout, which allows the export of your regression tables directly from Stata to Word documents or Excel. Isn’t that cool?

Website:http://repec.org/bocode/e/estout/installation.html

1. First, install this great module by typing the following command in Stata:
ssc install estout, replace

2. Run one OLS regression (the program can export many regression tables, but for now, we will limit ourselves to one).

1.png

3. When you are done, type the following:

esttab using test.rtf

4. You can find this file in my document\stata folder. It appears ike this:
2.png
5. If you are using have hierarchical regression/ nested regression, things can become a bit complicated. You have to store it by typing est store m1 after running your first regression. It would be look like this:

regress y x1 x2
est store m1
regress y x1 x2 x3 x4
est store m2
regress y x1 x2 x3 x4 x5 x6
est store m3
esttab * using test.rtf, replace 


6. The export file would appear like this:

3.png

7. If you would prefer the output to be in Excel format, you can use test.csv.

Endnote: import BibTex format

Friday, May 22, 2009

Endnote does not have an import filter for Bibtex format. However, Zotero or Jabref can be used to convert your bibliography. If you would prefer not to install additional programs on your computer, you could also try a tool here: http://www.it.usyd.edu.au/~tapted/bib2endnote.html This tool is capable of converting Endnote generated xml format from Bibtex. We have provided a syntax Bibtex file with which to practice: http://people.umass.edu/kbj/homepage/index_johnson.htm

Download bib2endnote.jar from the first website mentioned above. Ensure that you have Java Virtual Machine installed, run this tool, and open your bib file.

1.png

Be patient. It may require several minutes before you see the file in xml format in the right panel. Remember to save it.

2.png 

Run Endnote and begin the import.

3.png

Select your xml file, and remember to choose Endnote generated XML format under import option.

4.png