Stata: How to export descriptive statistics tables?

Friday, September 25, 2009

When performing statistics analysis, the first thing you would probably do is to run descriptive statistics. Knowing how to export tables of descriptive statistics can save a considerable amount of time.

If you would like to obtain the exact results that I did, you could use the following code for your  dataset:

use http://twtcsl.org/dataset/gss2000.dta
tab race
tab race sex
sum race sex age income
tab race, gen(d)
rename d1 dwhite
rename d2 dblack
rename d3 dother
tab sex, gen(d)
rename d1 dmale
rename d2 dfemale
sum dwhite dblack dother dmale age income if !mi(age) & !mi(income)


The results:

5.png

How do we export it? You can use EDIT-COPY TABLE in stata dropdown menu, or write some code to do the work.

estpost sum dwhite dblack dother dmale age income if !mi(age) & !mi(income)
esttab using sum2.rtf, cells("mean(fmt(2)) sd(fmt(2)) min(fmt(1)) max(fmt(0))") nomtitle nonumber replace


The export table looks like this:
1.png

To obtain three digits after the decimal point, change fmt(2) to fmt(3).

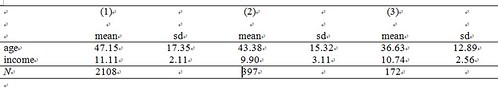
If you require more advanced descriptive statistics tables, for example, if you wanted to determine age and income by race, you could use the following codes:

sort race
by race: eststo: estpost sum age income if !mi(age) & !mi(income)
esttab using grp_sum.rtf, cells("mean(fmt(2)) sd(fmt(2))") replace


This result in a neat table:
2.png
If you are unable to export tables, check this article
Stata: Export OLS regression table to Word or Excel
and install the estout package.
 

Stata: Dealing with missing values

Friday, September 4, 2009

Dealing with missing values is probably the first thing you do after labeling your variables. Unfortunately, this is not an easy job and many users use inappropriate means to accomplish it. Let’s start at the very beginning.

In Stata 7 and previous versions use only one default missing value “.” (without quote). If you wish to exclude missing values, it would be correct to use the:

if variable !=.

Sample code for OLS regression would resemble the following part:

regress a b if c!=. & d!=.
regress a b c if d!=.
regress a b c d


This would be 100% correct if you used an old Stata dataset; however, if your dataset in had different missing values, this code would be problematic. Stata 8 and later versions allows you do define different types of missing values, each of which begins with a “.” (without quote), such as .a, and .b. Therefore, if you have these missing values in your dataset and you use old code like that above, you would probably obtain inconsistent observation numbers.

The correct way to perform this would be to use if c <. or if  !mi(c). The revised code would similar to:

regress a b if !mi(c) & !mi(d)
regress a b c if !mi(d)
regress a b c d


What if you have 20 variables in your regression? Such if statements often result in very long lines, thereby reducing the readability of your code. There are two easy ways to overcome this: 1) creating a dummy called “touse” with 1 representing valid values for all variables; and 0 for at least one missing value.

gen touse =!mi(y, a, b, c, d)
regress y a b if touse
regress y a b c if touse
regress y a b c d if touse


2) If you don’t like this approach, you can also deal with missing values by using nestreg:

nestreg: reg y (a b) (c) (d)