
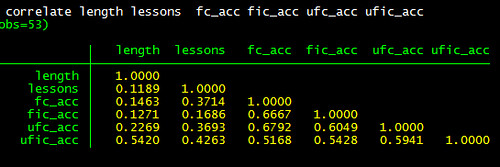
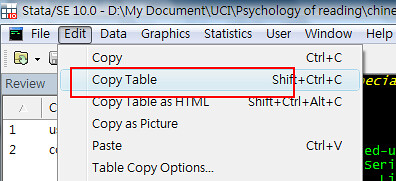
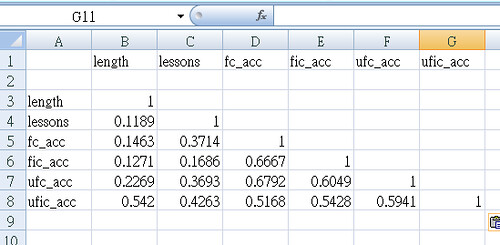
You then paste it into Excel and do some editing.
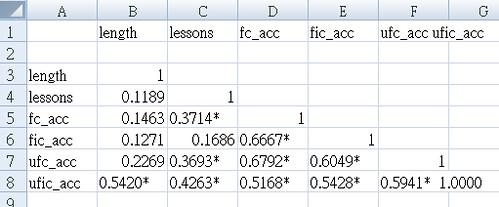
If you would like stars after your correlation coefficient, run a command like this:
pwcorr X1 X2 X3 X4, star(.05) and then copy the table as mentioned above. It will look like this when you paste it into Excel
The second way is to use esttab, in which the command looks like this:
estpost correlate x1 x2 x3 x4, matrix listwise
est store c1
esttab * using test_correlation.rtf, unstack not noobs compress


Comments
No response to “Stata: Outputting correlation tables” Post Comments (Atom)
Post a Comment |
Post a Comment